Visualizing back pressure and reactive streams with akka-streams, statsd, grafana and influxdb
Currently reactive programming is getting more and more attentions. With reactive programming it is possible to easily create resilient, scalable and fault tolerant systems. In this article we’ll show some examples of reactive programming, and more specifically how backpressure works in practice. For this we’ll use akka-streams since I really like the Scala and Akka programming model, and they have a great DSL for defining flows of data. If you’re a bit new to reactive programming and Akka, a great introduction can be found at slideshare which I’ve included here:
In this article we’ll visualize a number of scenarios which will show how backpressure and certain flow constructs provided by akka-streams influence the producer of events (the source) and how it affects the subscriber (the sink) to these events. To visualize this data we’ll use a set of simple traits I created for some experiments with monitoring akka actors (sources can be found here: http://github.com/jos.dirksen/akka-mon), together with statsd, influxdb and grafana. For those of you now familiar with these technologies a quick explanation:
- akka-mon (https://github.com/josdirksen/akka-mon): Just a very simple project I started to experiment some more with monitoring Akka systems. It allows you to add traits to your actors which enable some simple performance and count logging. <li statsd (https://github.com/etsy/statsd): Statsd is a simple event collector. It will collect events from any source, aggregate them, and every 30 seconds output a summary of what was collected.</li>
- influxdb (http://influxdb.com): Influxdb is a database specifically created for storing time series. We use influxdb to store the summarized metrics from statsd.
- grafana (http://grafana.org/): Finally we need some way to visualize the data. Influxdb itself already contains a simple visualization, but nothing that can easily be used. So for this final component we use grafana. With grafana we can make selections from the influxdb database and visualize them in all kinds of graphs.
So basically with these components installed and configured we have the following flow:
- akka-mon will send an event (using UDP) to statsd whenever a message is send or received by one of the configured actors. In our sceneria we send an event when the publisher sends a message, and when one of the subscribers receives a message.
- These messages will be collected by statsd and every 30 seconds statsd sends an update of what it has received to influxdb. Influxdb will just store all this information.
- To visualize this information we'll configure grafana to connect to the influxdb API so it can retrieve the stored information and visualize it on screen
As you can see there are a number of moving parts that need to be installed or configured to get all this working correctly. If you want to try this for yourself, I’ve added all the configuration files and the source code of the scenarios to github here (https://github.com/josdirksen/akka-back-pressure).
Getting started
I’m not going to explain all the configuration files and installation instructions of the various tools that are used. The default installations of influxdb, statsd and grafana should suffice, and the relevant configurations files can be found
In this method we use a flow graph to create a new source, which we can use in out other flows. This source combines two existing sources to create a new one. We use a simple source created from a range to produce a number of messages and we use a tick source to throttle the amount of messages that should be send per second. This works in the following manner:
- The range source immediately starts producing events.
- This event is passed on to the zip component.
- The zip component now waits till it receives an event on both its inputs.
- The tickSource produces events at the interval we specified.
- Now when the tickSource produces an event, both inputs for the zip component will have received an element, and the zip component combines these into a tuple and sends them over the zip.out connector.
- The unzip component (just a simple map function) receives this tuple ([Int, Tick]), and only passes on the event received from the rangeSource.
- We have a final step called sendMap. This step is added so that we can receive metrics in statsd which we can eventually visualize in grafana.
Since this graph is a source we need to return an unconnected outlet. In this case we return sendMap.outlet and now we have a source whose message rate can be easily controlled.
First scenario: Fast source and fast subscriber
Now lets see what happens when we start processing messages for our first scenario. In this scenario we’ll use a source which produces around 30 messages per second and a subscriber that is faster. So in this scenario the rate of the subscriber should be equal to the rate of the publisher. Lets first look at the code that specifies the flow for this scenario:
In this scenario we connect the source (which we showed above) to an actor sink. An actor sink is an standard Akka actor which, in our case, requests events/messages as fast as they become available. In this example we use an Actor where we can configure a delay to simulate slow subscribers. This Actor looks like this:
To work with akka-streams this actor must extend the ActorSubscriber trait and define a requeststrategy (see documentation (link) for more information on this). As you can see this is a very simple actor, which just processes the message and waits for the specified delay. Note that the other traits are just monitoring traits which send metrics to statsd.
Now, lets see what happens when we run this example (if you do this yourself, make sure statsd and influxdb are also running). With the results in influxdb, we can use grafana to create a graph which shows the number of messages created by the source and processed by the subscriber.
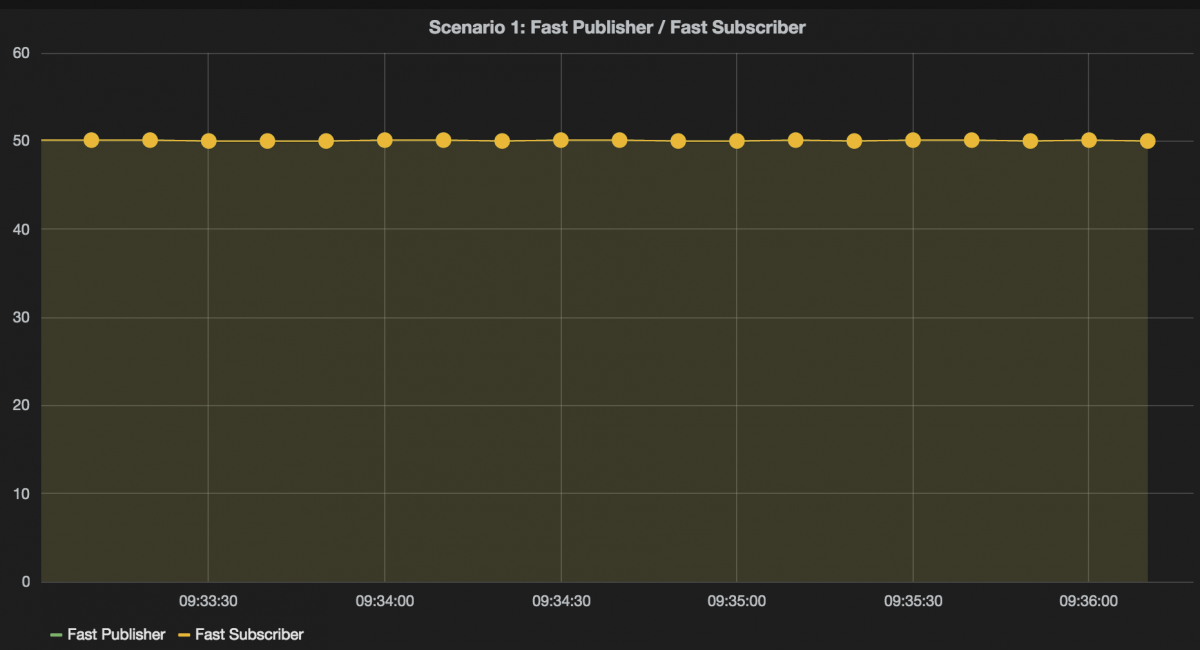
As you can see, no suprises there. The rate of the subscriber is exactly equal to the rate of the publisher and hovers around the 30 messages per second.
Second scenario: Fast source and slowing down subscriber
So in the next scenario lets look and see how back pressure can affect the rate of our publisher. If you’ve viewed the presentation at the beginning of this article, you know that with back pressure a slow consumer can limit the rate a publisher sends event and vice versa. So in this scenario we’ll simulate a consumer which gets slower after each message it has processed:
For this scenario we use a different actor, the SlowDownActor. This actor will run slower each time it has processed a message:
In the receive message of this actor we do a Thread.sleep with an increasing delay. In this scenario, since we use backpressure, the rate of the publisher is controlled by the speed at which the subscriber can process messages. This can be seen in the resulting grafana graph:
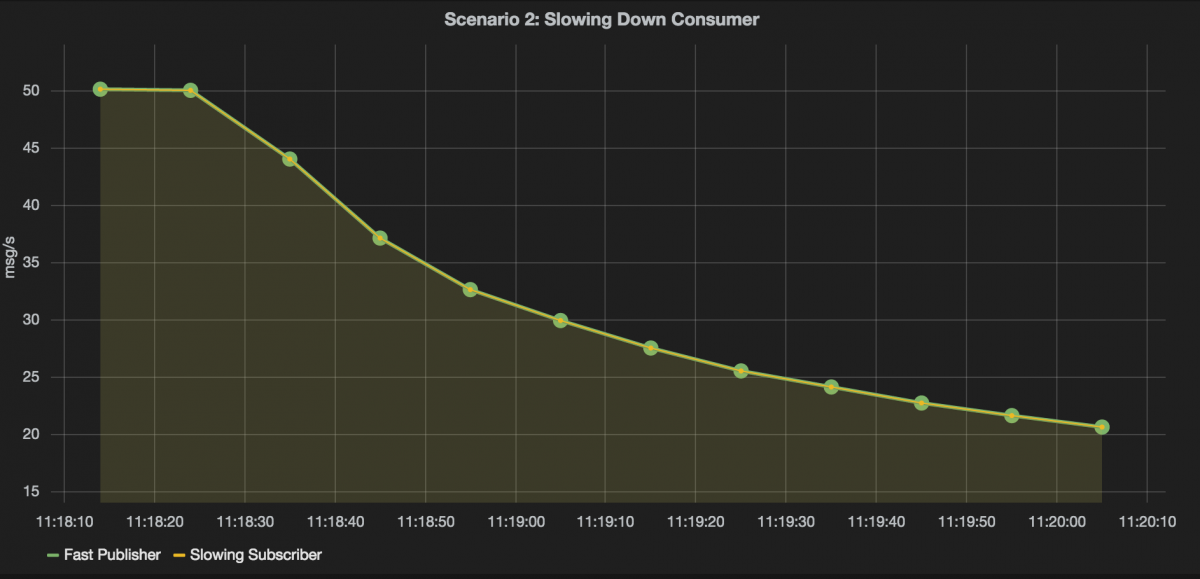
In this graph both the subscriber and publisher rates are the same, and slowly go down as the delay in the subscriber increases.
Third scenario: Fast publisher, fast subscriber which gets slower, with drop buffer
In this scenario we introduce a specific buidling block provided by akka-streams, the buffer. If an upstream subscriber is to slow, the buffer will store a specific number of messages before either telling the publisher to slow down, or it will start dropping messages. We’ll use the following scenario:
We start producing 5000 messages at a rate of 50 per second. These messages get buffered in the buffer and finally consumed by the ‘slowingSink’, which is a SlowDownActor (see code above). We’ve configured the buffer with a size of 100 and an OverFlowStrategy of dropHead, which means we’ll drop the oldest message in the buffer when new ones arrive. When we run this scenario you’ll see the following:
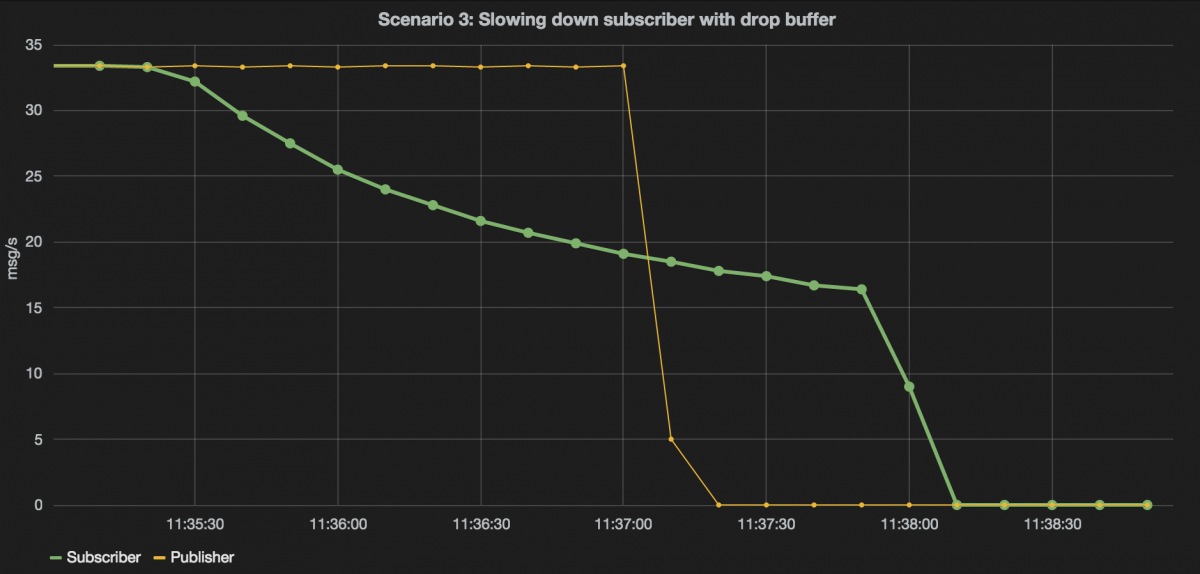
You can see that the rate of the subscriber is effectively ignored. This is because we’ve set the OverflowStrategy to OverflowStrategy.dropHead. Interesting to note here is that the subscriber keeps processing messages some time after the publisher has stopped. This is because there are still messages in the buffer. If we set this to OverflowStrategy.backPressure, once the buffer is filled the producer will slow down:
val buffer = Flow[Int].buffer(2000, OverflowStrategy.BackPressure)
This results in the following grafana graph:
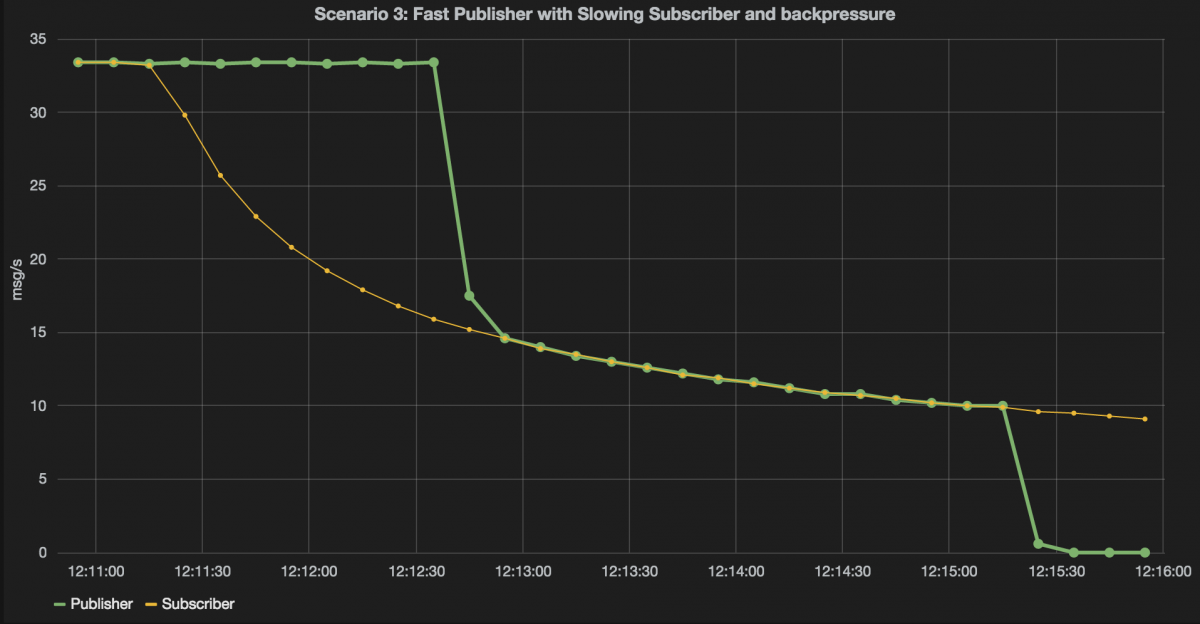
Here we see that the rate of the producer stays high, while that of the subscriber is low. This is the phase where the buffer is filling up. Once the buffer is filled up, the backpressure kicks into action and the the rate of the producer drops to the rate of the subscriber. When the publisher is done, the subscriber will happily keep on processing messages, until its buffer is empty.
Fourth scenario: Fast publisher, one fast consumers, one consumer which gets slower
So far we’ve only seen 1 publisher and 1 consumer, in this scenario we’ll look at the effect of two subscribers on the same publisher:
For this we use the Broadcast construct. With a broadcast we duplicate the message and send it to multiple subscribers. In this scenario we have one slow subscriber and one fast subscriber. The result of this can be seen in the following graph:
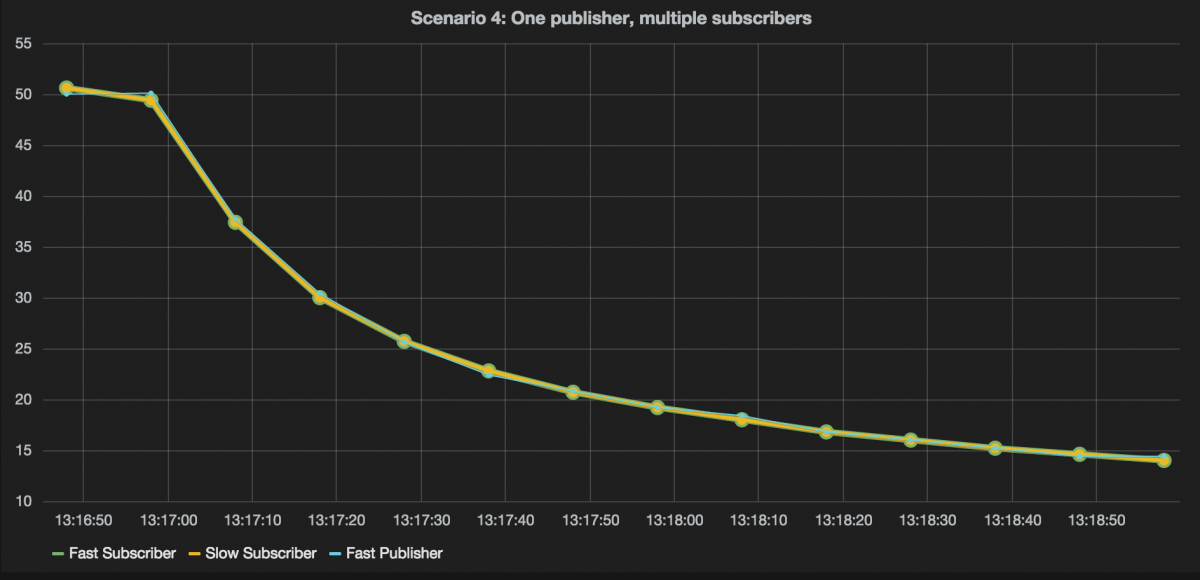
Here you can see that the rate of the publisher is defined by the rate of which the slow subscriber can process messages. This happens because the slow subscriber informs the publisher to slow down. This in term also affects the fast subscriber.
Fifth scenario: Fast publisher, one fast consumers and one slow consumer which gets slower but has buffer with drop
In the previous scenario we saw that the rate of a publisher drops to the slowest subscriber. An alternative approach is to use a buffer between the slow subscriber and the publisher. This way you can specify whether one slow subscriber is allowed to slow down the publisher. This is what we do in the following scenario:
In this scenario the source first sends messages to a broadcast component, the broadcast component duplicates the message and sends it to the downstream components. As you can see the broadcast is directly connected to a fast subscriber, and the other outlet of the broadcast is first connected to a buffer and finally to a sink which gets slower. This results in the following output:
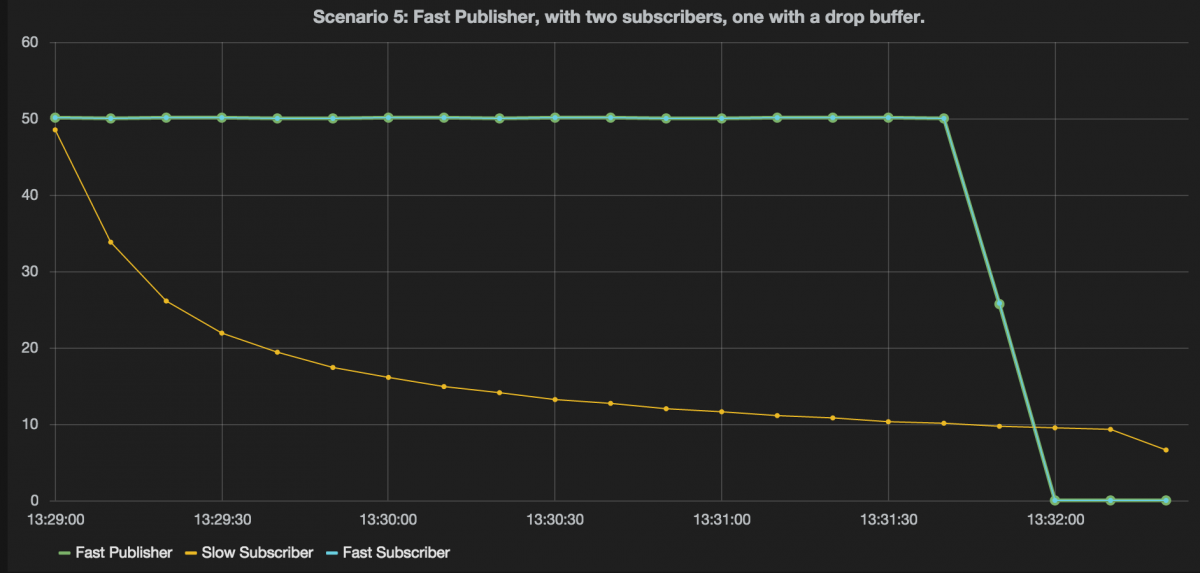
Compare this graph to the previous one we saw. Here we see that the rate of the publisher and the fast subscriber stays at the same rate. The reason is that the messages are dropped by the buffer we added before the slow subscriber.
When we change the buffer to stop dropping messages, and use backpressure instead we get the following:
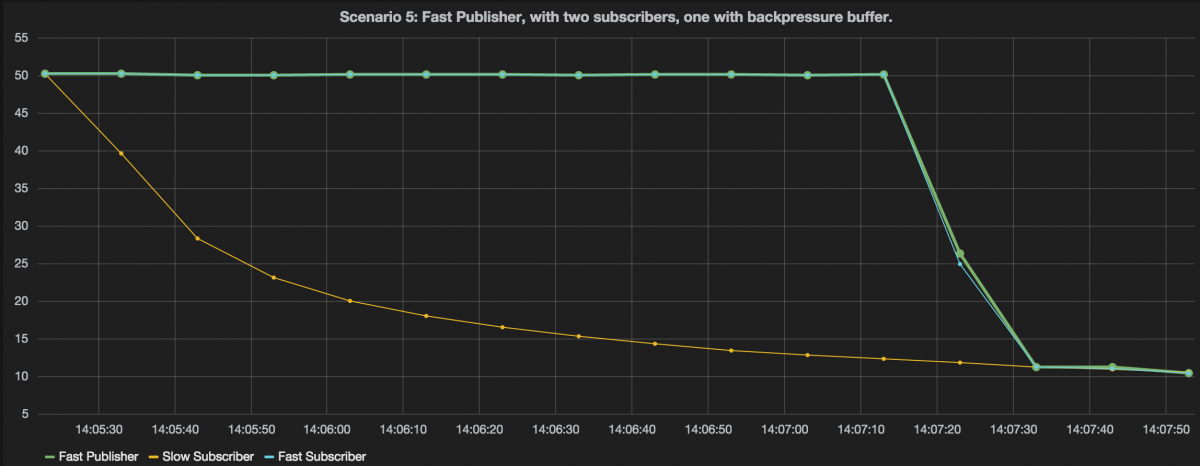
Here we see that while the buffer is filling up, both the fast subscriber and publisher can keep a high rate. Once the buffer is filled up, however, the rate drops down to the rate at which the slow subscriber can process messages.
Akka-streams offers a number of other graph components you can use to define a message flow. One interesting one to look at, and also the last one, is the balancer.
Sixth scenario: Fast publisher, fast subscriber and a slowing down subscriber together with a balancer
A balancer component sends the message to a subscriber which is available. So in our case more messages will be sent to the fast subscriber than to the slow subscriber. As the slow subscriber gets slower, more and more messages will be processed by the fast subscriber:
This results in the following graph:
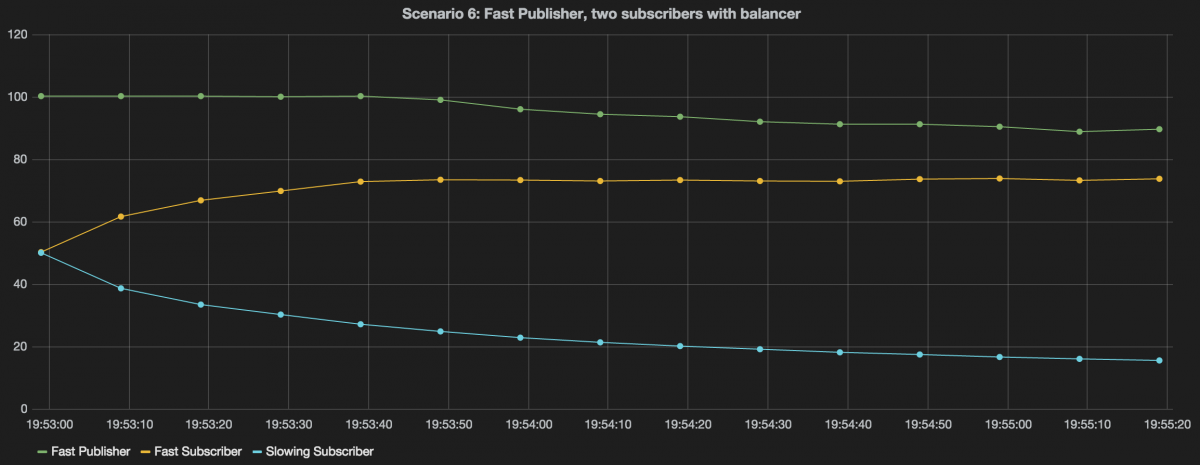
This graph shows the expected behavior. One interesting part to note is that at a certain point the publisher also starts slowing down. The reason is that the fast subscriber gets more and more messages and at a certain point can’t keep up with the publisher. At this point backpressure kicks in slows down the publisher.
Conclusions
So what can we conclude from all this? What you can see is that with reactive-streams and backpressure it is really simple to make sure that the rate of a publisher and subscriber are nicely aligned. This allows for great control of the flow, avoids memory overflows, and with the additional flow constructs it is really easy to support more advanced scenarios.
There is much more to learn about reactive-streams, akka-streams and all the various ways you can use this. What really helped me a lot understanding this, is by looking at the graphs. I think they really nicely show how backpressure (and the other constructs) affect publisher and subscribers of event streams.