CPI Interactive index (15 years) created with Angular.js, bootstrap and d3.js
Long time since I posted anything. But it’s been a busy time with the holidays a new job and a week of snowboarding :) So after this short hiatus a quick article to highlight a web application I created a couple of weeks ago before the holidays.
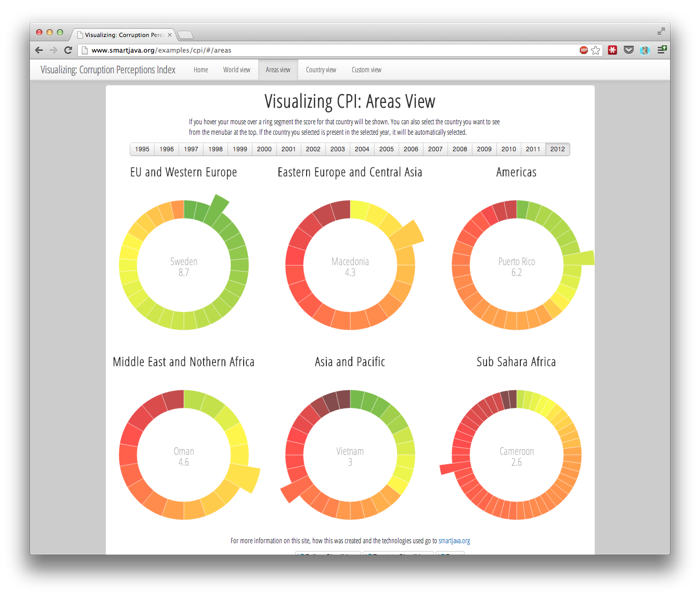 If you click on the image the application will open and you can play around with the “corruption perception index” statistics from the last 15 years. I’ll try to get a couple of article on line the next couple of days or weeks explaining some of the frustations and revelations I had when working with the combination of Bootstrap, Angular.js and D3.js.