HTML5: Render open data on a 3D world globe with Three.js
With Three.js it’s very easy to create 3D objects and render these using WebGL. In a couple of previous articles I already showed how you can create 3D maps and even use elevation data to create 3D representations of the real world. In this article we’ll continue a bit further on this path. In this article I’ll show you how you can render open data based onto a 3D globe. For this first article I’ll show you how you can create the following ‘infographic’:
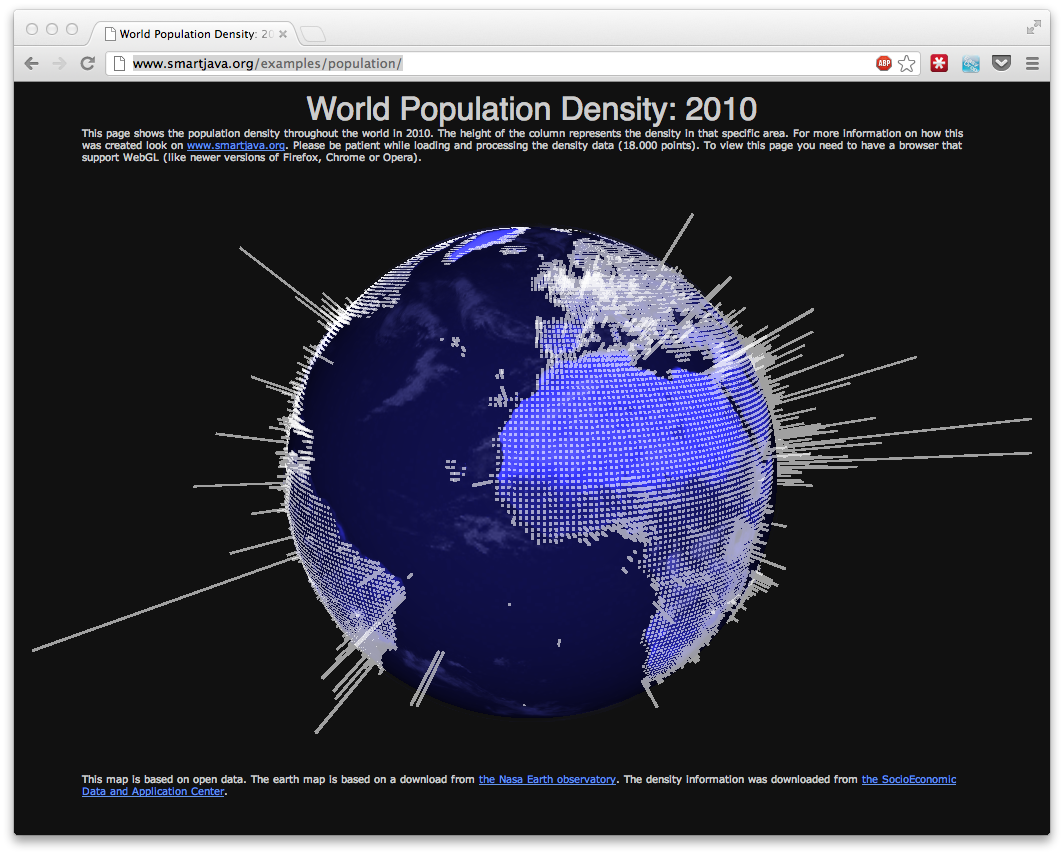
This graphic, of which you can find a working example here, shows the population density around the world, plotted onto a 3D globe, rendered using Three.js. To create this we need to take the following steps:
- Setup a Three.js scene
- Create a 3D world globe and add it to the scene
- Get density information and convert it to a format we can work with
- Convert each data point to a coordinate on the sphere
- Add all the information to the Three.js scene
- Rotate the scene, so we can see the whole world
Many steps, but really not so difficult to do. We’ll start, as with every Three.js project, with the basics, and add the Three.js initialization code.
Setup a Three.js scene
The following code is the basic code you need to get started.
   // couple of constants
    var POS_X = 1800;
    var POS_Y = 500;
    var POS_Z = 1800;
    var WIDTH = 1000;
    var HEIGHT = 600;

    var FOV = 45;
    var NEAR = 1;
    var FAR = 4000;

    // some global variables and initialization code
    // simple basic renderer
    var renderer = new THREE.WebGLRenderer();
    renderer.setSize(WIDTH,HEIGHT);
    renderer.setClearColorHex(0x111111);

    // add it to the target element
    var mapDiv = document.getElementById("globe");
    mapDiv.appendChild(renderer.domElement);

    // setup a camera that points to the center
    var camera = new THREE.PerspectiveCamera(FOV,WIDTH/HEIGHT,NEAR,FAR);
    camera.position.set(POS_X,POS_Y, POS_Z);
    camera.lookAt(new THREE.Vector3(0,0,0));

    // create a basic scene and add the camera
    var scene = new THREE.Scene();
    scene.add(camera);

    // we wait until the document is loaded before loading the
    // density data.
    $(document).ready(function()  {
        jQuery.get('data/density.csv', function(data) {
            addDensity(CSVToArray(data));
            addLights();
            addEarth();
            addClouds();
            render();
        });
    });
In this small piece of code we create a Three.js scene, a camera and append it to a specific element in the html page. I use JQuery to determine when the document is ready. Once the HTML page is completely loaded I read in the data to plot and add the various elements of this graphic. We start of easy, by creating the 3D globe of the earth (the addEarth and addCloud functions).
Create a 3D world globe and add it to the scene
    // add the earth
    function addEarth() {
        var spGeo = new THREE.SphereGeometry(600,50,50);
        var planetTexture = THREE.ImageUtils.loadTexture( "assets/world-big-2-grey.jpg" );
        var mat2 =  new THREE.MeshPhongMaterial( {
            map: planetTexture,
            shininess: 0.2 } );
        sp = new THREE.Mesh(spGeo,mat2);
        scene.add(sp);
    }
We start of with a very basic earth. This earth is rendered as perfect sphere (which the earth in reality isn’t), where we add a texture that is a satellite map of the earth. I converted the map to grey scale to make it less prominent in the finalized scene. Good starting material for maps of the earth can be found from nasa here: http://visibleearth.nasa.gov/view_cat.php?categoryID=1484 .The basic earth map doesn’t contain clouds, we can easily add them by creating a somwhat bigger sphere with a cloud texture.
    // add clouds
    function addClouds() {
        var spGeo = new THREE.SphereGeometry(600,50,50);
        var cloudsTexture = THREE.ImageUtils.loadTexture( "assets/earth_clouds_1024.png" );
        var materialClouds = new THREE.MeshPhongMaterial( { color: 0xffffff, map: cloudsTexture, transparent:true, opacity:0.3 } );

        meshClouds = new THREE.Mesh( spGeo, materialClouds );
        meshClouds.scale.set( 1.015, 1.015, 1.015 );
        scene.add( meshClouds );
    }
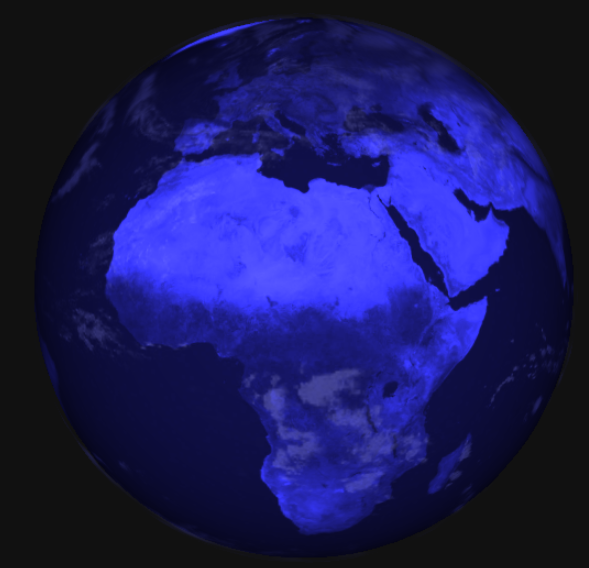
I’ve used the clouds texture from the Three.js examples, but you can also find different other textures online. Now all we need to do is add some lights and we’ve got our basic globe setup.
    // add a simple light
    function addLights() {
        light = new THREE.DirectionalLight(0x3333ee, 3.5, 500 );
        scene.add( light );
        light.position.set(POS_X,POS_Y,POS_Z);
    }
This adds a basic directional light (at the same position as our camera). I’ve used a blue-ish color here. If we render this scene we get the following: an earth rendered with a blue glow.
Get density information and convert it to a format we can work with
With the basic globe rendered we need to get some information that we can use to plot on this globe. For this example I used population density information from Socioeconomic Data and Applications Center - SEDAC. From there you can download density information in various formats. I used the 1 degree ascii format, which contains a data point for each lat/lon combination of the earth. This format looks something like this:
ncols         360
nrows         143
xllcorner     -180
yllcorner     -58
cellsize      1.0000000000008
NODATA_value  -9999
value1 value2 value3 value4 value5 (repeated 360 times)
value1 value2 value3 value4 value5 (repeated 360 times)
So we got 143 rows and 360 columns representing data for the complete earth. In my first try I converted this to json data, but the resulting file was 1.5MB and took some time to parse. So in the next try I just stripped the header, and saved it as a simple cvs file, where each line is an x,y coordinate.
102,1,0.0003149387
103,1,0.0003149386
104,1,0.0003149387
105,1,0.0003149387
106,1,0.0003149387
107,1,0.0003149386
108,1,0.0003149387
109,1,0.0003149387
110,1,0.0003149387
133,1,0.008578668
etc..
This also allowed me to filter out the -9999 values and makes processing in javascript easier. To load this data I use jquery:
jQuery.get('data/density.csv', function(data) {
            addDensity(CSVToArray(data));
             ...
        });
And use the CSVToArray function to convert the data to an array of arrays. The CSVToArray function was copied from this stackoverflow article: http://stackoverflow.com/questions/1293147/javascript-code-to-parse-csv-data
At this point we’ve got a set of x,y coordinates (in WGS84 style) that we can use to plot this information on a 2D map (as is done on the SEDAC) site. We need to convert this x,y to a point on our sphere.
Convert each data point to a coordinate on the sphere
Now how do we convert a point in a 2D space to a 3D sphere? Luckily there are a set of standard methods for this. This wikipedia article explains how to convert between the various coordinate systems. Without diving too much into the details, the javascript code to do this is the following:
    // convert the positions from a lat, lon to a position on a sphere.
    function latLongToVector3(lat, lon, radius, heigth) {
        var phi = (lat)*Math.PI/180;
        var theta = (lon-180)*Math.PI/180;

        var x = -(radius+heigth) * Math.cos(phi) * Math.cos(theta);
        var y = (radius+heigth) * Math.sin(phi);
        var z = (radius+heigth) * Math.cos(phi) * Math.sin(theta);

        return new THREE.Vector3(x,y,z);
    }
This function converts a x,y coordinate to a point in a 3D space. The radius supplied here is the radius of our earth, and the height is used as an offset of how high above the surface we want to start drawing.
Add all the information to the Three.js scene
With all this in place we can render the density information on the scene. We do this in the following javascript function.
    // simple function that converts the density data to the markers on screen
    // the height of each marker is relative to the density.
    function addDensity(data) {

        // the geometry that will contain all our cubes
        var geom = new THREE.Geometry();
        // material to use for each of our elements. Could use a set of materials to
        // add colors relative to the density. Not done here.
        var cubeMat = new THREE.MeshLambertMaterial({color: 0x000000,opacity:0.6, emissive:0xffffff});
        for (var i = 0 ; i < data.length-1 ; i++) {

            //get the data, and set the offset, we need to do this since the x,y coordinates
            //from the data aren't in the correct format
            var x = parseInt(data[i][0])+180;
            var y = parseInt((data[i][1])-84)*-1;
            var value = parseFloat(data[i][2]);

            // calculate the position where we need to start the cube
            var position = latLongToVector3(y, x, 600, 2);

            // create the cube
            var cube = new THREE.Mesh(new THREE.CubeGeometry(5,5,1+value/8,1,1,1,cubeMat));

            // position the cube correctly
            cube.position = position;
            cube.lookAt( new THREE.Vector3(0,0,0) );

            // merge with main model
            THREE.GeometryUtils.merge(geom,cube);
        }

        // create a new mesh, containing all the other meshes.
        var total = new THREE.Mesh(geom,new THREE.MeshFaceMaterial());

        // and add the total mesh to the scene
        scene.add(total);
    }
In this code we do the following:
We first convert the x,y from the input format to the -90,90 - 180,-180 range.
            var x = parseInt(data[i][0])+180;
            var y = parseInt((data[i][1])-84)*-1;
            var value = parseFloat(data[i][2]);
</javscript>

 <h4>These coordinates are converted to a point on the sphere and used to draw a cube</h4>

Using the function we described earlier, we convert the x,y to a position on the sphere. These values are then used to create a cube.
        // calculate the position where we need to start the cube
        var position = latLongToVector3(y, x, 600, 2);

        // create the cube
        var cube = new THREE.Mesh(new THREE.CubeGeometry(5,5,1+value/8,1,1,1,cubeMat)); ```
You can see that we use the value as the height op the sphere.
Rotate the cube so it nicely aligns with the globe
If we render the scene as this we get nice cubes but they all point ‘upwards’, they aren’t rendered aligned with the surface of the sphere. Aligning these objects according to the normal vector of the surface normally requires some interesting math. Luckily though, Three.js has a simpler option for us. we can use this:
cube.lookAt( new THREE.Vector3(0,0,0) );
To make the object ‘look’ at a specific point in space. If we make the object look at the center of the Sphere it will be aligned correctly.
Reduce number of objects to add
We made one optimization before adding the cubes to the scene.
  function addDensity(data) {
        var geom = new THREE.Geometry();
        var cubeMat = new THREE.MeshLambertMaterial({color: 0x000000,opacity:0.6, emissive:0xffffff});
        for (var i = 0 ; i < data.length-1 ; i++) {
            ...
            var cube = new THREE.Mesh(new THREE.CubeGeometry(5,5,1+value/8,1,1,1,cubeMat));
            ...
            THREE.GeometryUtils.merge(geom,cube);
        }
        var total = new THREE.Mesh(geom,new THREE.MeshFaceMaterial());
        scene.add(total);
    }
The important method here is the merge method. What this method does is it copies all the faces and vertices from the cube we created to the geometry we created in the beginning of this function. The reason we do this, is that we now only have to add a single object to the scene, instead of 18000. This will massively increase rendering speed. We also reuse the material, which is another big rendering optimization.
However, this is still a fairly heavy 3D object, so rendering, especially on slower hardware can take some time. On the other hand, I was able to view this on my 2 year old smartphone.
Rotate the scene, so we can see the whole world
The final step we add is a simple rotating animation. This time I rotate the camera and the light.
    function render() {
        var timer = Date.now() * 0.0001;
        camera.position.x = (Math.cos( timer ) *  1800);
        camera.position.z = (Math.sin( timer ) *  1800) ;
        camera.lookAt( scene.position );
        light.position = camera.position;
        light.lookAt(scene.position);
        renderer.render( scene, camera );
        requestAnimationFrame( render );
    }
And that’s it. The complete example can be found here.