Analyzing swearing in movies Part 1: Swears per minute
In this short article I’d like to explain the process I took to create some simple D3.js visualizations based on the number of swears per minute in movies. I’m going to do some additional analysis on this, but for now I’d just like to so you some samples, and code fragments that explains the process I’ve used. This article is inspired by some data from http://fivethirtyeight.com that showed the swearing in tarantino movies: http://fivethirtyeight.com/features/complete-catalog-curses-deaths-quentin-tarantino-films/
For the fivethirtyeight article, someone actually counted the individual swearwords, which, although I like Tarantino movies, isn’t really something I have the time for to do. In this article I show you how you can automate this.
First off, though, lets look at some results. Note that I haven’t spent much time on the visuals, so it are just rather basic charts at the moment.
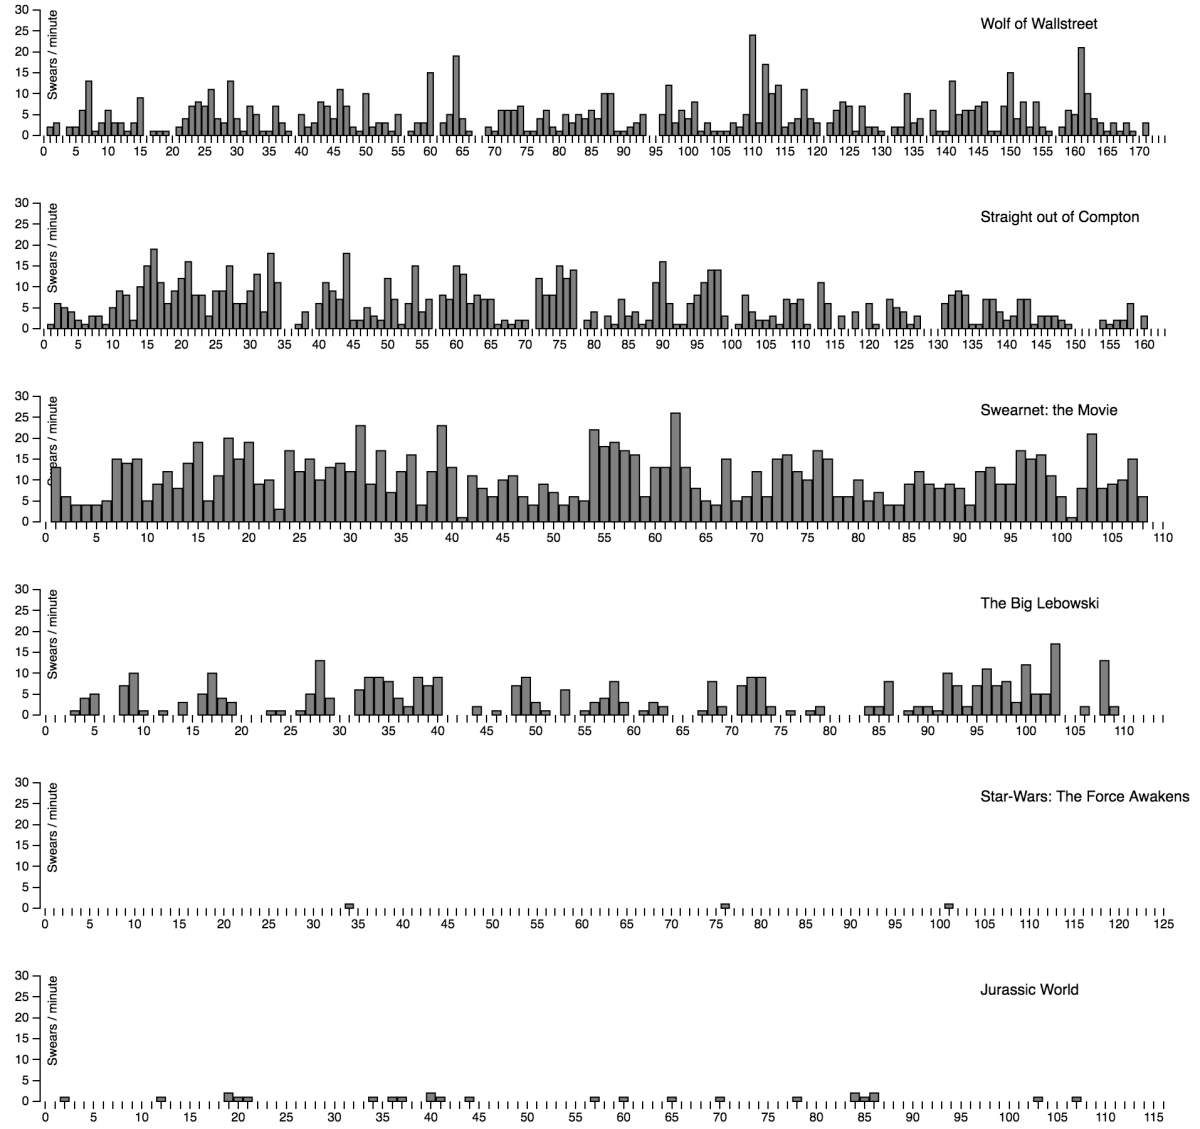
- Swears per minute as a bar graph: http://www.smartjava.org/examples/swears/timeLine.html
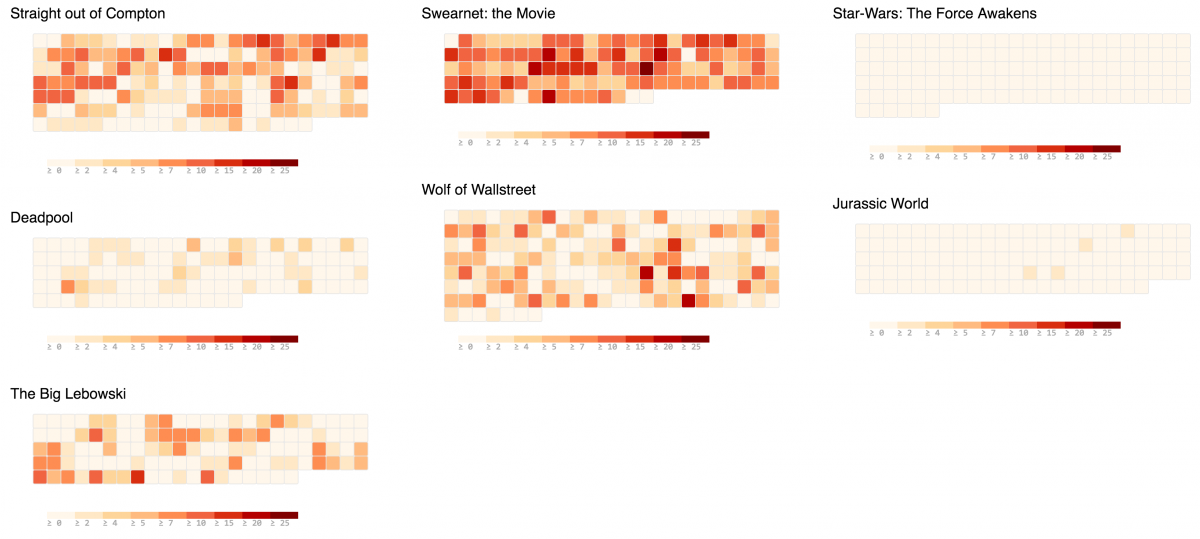
- Swears per minute as a heatmap: http://www.smartjava.org/examples/swears/timeLine.html
For those not wanting to see the real D3.js SVGs, the following images show pretty much the same.
Bars:
Heatmap:
So how do we do this. Well, the first thing to do is get the number of swearwords per minute. I mentioned that for the original article someone just counted every swearwords, in our case, we’re just going to parse a subtitle file, and extract the swear words from that.
Scala analysis
Without going into too much detail, you can find the code I’ve experimtend with in this gist (it’s very ugly code, since I just hacked something together that worked).
The code isn't that interesting. A couple of pointers though:

<ol>
  <li>I've used the srt parser from here: https://github.com/implicitdef/srt-parser, this allows me to simply parse a srt file, and access the content.</li>
  <li>In this code we check for swearwords against a file containing all the swears. This file is based on a slightly modified version from here: https://gist.github.com/ryanlewis/a37739d710ccdb4b406d</li>
  <li>For now I just output the swears per minute, but this can also be used to easily count which swearwords are the most popular, etc.</li>
</ol>

The output from this program is a csv list in the following format:
time,swears 0,0 1,2 2,3 3,0 4,2 5,2 6,6 7,13 8,1 9,3 10,6 11,3 12,3 13,1 14,3 15,9 16,0 17,1 18,1
```
Where time is the minute we’re in, and swears are the number of swear words said in that minute. So now that we’ve got the swear words, we can use D3.js to visualize them.
Bar graph
For the bar graph the following code is used:
Heat map
And for the heatmap we use the following:
If you’re familiar with D3.js you can see that it are just the basic graps extended for this purpose.
And that’s it for this very simple first part of visualzing dirty words ;) More in the coming weeks, since I’ve got a couple of other visualizations in mind.